
Platelet proteolytic machinery assessment in Alzheimer's disease
 0
0
Abstract
Aim: Platelets provide substantial information about the proteolytic system profile in neurodegenerative diseases. Assessment of autophagy and proteasome target proteins in platelets may reflect the tissue proteolytic machinery profile in the central nervous system of patients with Alzheimer’s disease (AD). We aimed to demonstrate the optimum assay conditions and identify target proteins in platelet proteolytic machinery.
Methods: Platelet samples were obtained from clinically verified AD patients and age-matched non-demented control subjects who were recruited by the University of Kansas Alzheimer’s disease Center. Autophagosome participating proteins in platelets were identified by Western blotting analysis. Standard gel electrophoresis and electro transfer apparatus were used for protein transfer onto the membrane. Several antibodies were tested to identify the best working antibodies, and their concentrations were optimized. An enzyme-linked immunosorbent assay kit was used for platelet proteasome protein determination. Infrared imaging technology was used for visualizing the proteins on the membrane.
Results: Autophagosome participating proteins showed elevated levels in AD patient platelet cytosol. Only light chain 3-1 autophagosome protein levels were significantly elevated. The concentrations of platelet lysate proteasome were assessed. AD patient’s proteasome levels were elevated but they were statistically not different from controls.
Conclusion: Platelets can be used for assessing whether the proteolytic system is functional. Blood-based sampling from human donors is less-invasive and analyzing the platelet proteolytic system profile may help to develop pharmaceutical intervention approaches for neurodegenerative diseases in general.
Keywords
Introduction
The purpose of this study was to demonstrate whether human blood-derived platelets can provide critical information about malfunctioned proteolytic machinery leading to diseased protein aggregation in the neurodegenerative disease. Alzheimer’s disease (AD) is mainly characterized by protein aggregations and deposition that are toxic and lethal to cellular structures in the central nervous system[1]. The proteolytic system that includes autophagy and proteasome pathways degrade and allow recyclization of targeted molecules and organelles in all eukaryotic cells [Figure 1]. The reason certain proteins are allowed to aggregate is the inhibition of proteolysis and down regulation of effector proteins that stimulate the pathogenesis of the degradation[2]. A dysfunctional proteolytic system, including autophagy and proteasome, is implicated in the pathogenesis of AD. Autophagy is a lysosomal degradative process by which cellular residents are inducted into homeostasis through quality control by clearance of pathogenic proteins, recycling of macromolecules, and response to energy requirements[3]. In neurodegeneration, this system has been proven dysfunctional and therefore associated with lack of proper protein disposal and thereby aggregation[4]. A two-stage autophagy impairment (i.e., induction and lysosomal acidification) leads to pathogenesis of AD[2]. During the induction process, autophagy requires the release and presence of beclin-1 protein from endoplasmic reticulum and formation of a multimeric complex[2]. This is the site of autophagy initiation through vesicle nucleation and then formation of isolation membrane[5]. Beclin-1 is a crucial regulator of autophagy. Its expression in the hippocampus is decreased at the RNA and protein levels in AD patients with advanced age. This protein is necessary for nucleation of a phagophore membrane before the autophagosome vesicle is fully formed[6]. This concept produced comparative results against control subjects that demonstrated an increase in protein aggregation[7].
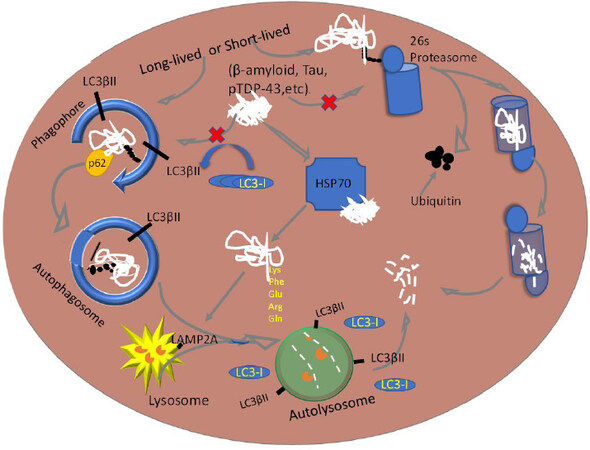
Figure 1. Schematic diagram of the proteolytic system in autophagic and proteasomal pathways
Proteasomes are molecular machines that degrade aberrant proteins through a polyubiquitination process followed by recognition by the regulatory particle deubiquitylation by deubiquitinase, and finally degradation of proteins into fragments[8]. In AD, the components that are linked to this pathology are abnormal formation of ubiquitin and activity inhibition[9,10]. For example, paired helical filaments of tau bind to proteasomes and thereby reduce its activity[9], resulting in less polyubiquitination Without this step, a protein without proper ubiquitination cannot be recognized by the regulatory particle of the proteasomes[11]. Therefore, the autophagy and proteasome activities are a critical component and can be measured in platelets. Although the functions of autophagy within platelets are largely unclear thus far, it is known that its impairment leads to a lack of platelet aggregation and adhesion[12].
We demonstrated that a TAR-DNA/RNA binding protein (TDP-43) and its phosphorylated derivative (pTDP-43) levels were elevated in platelets obtained from AD patients as part of the blood-based biomarker development studies[13]. In this pilot study, we assessed the profile of target proteins for proteolytic machinery in platelet lysates obtained from AD patients and non-demented control subjects.
Methods
Human platelets
AD patients and age-matched non-demented control subject human platelets were obtained from the biorepository of the University of Kansas Alzheimer’s Disease Center under the approved Institutional Review Board protocol (KUADC#11132). The 5-6-day-old platelets were obtained from a local community blood center for initial studies before analyzing AD patients and control human platelet samples.
Materials
Antibodies
MBL antibodies (MBL International, 15A Constitution way, Woburn, MA 01801, USA): Anti-LC3 (pAb, PM036Y), Anti-LC3 (8E10, mAb, M186-3Y), Anti-LC3 (4E12, mAb, M152-3Y), Anti-Beclin-1 (pAb, PD017Y), Anti-Atg16L (pAb, PM040Y), Anti-p62 (SQSTM1, pAb, PM045Y), Anti-Atg5 (pAb, PM050Y), and Positive control for anti-LC3 (PM036-PNY).
Cell signaling antibodies (Cell Signaling Technology, 3 Trask Lane, Danvers, MA 01923, USA): Anti-Beclin-1 (pAb, 3738S), LC3A (mAb, 4599S), and LC3B (pAb, 2775S).
Abcam antibody (Abcam, Inc., 1 Kendall Square Suite, B2304, Cambridge, MA 02139-1517, USA): p62 (SQSTM1, AB56416).
Sigma antibody (anti-p62/SQSTM1 antibody and P0067).
Secondary antibodies (LI-COR Inc., 4308 Progressive Ave., Lincoln, Nebraska 68504, USA): Goat anti-Mouse (green wavelength) antibody (Li-Cor, C40213-01), Goat anti-Rabbit (green wavelength) antibody (Li-Cor, C30829-02).
Sodium dodecyl sulfate polyacrylamide gel electrophoresis and Western blotting reagents
Butanol, 1.5 M Tris-HCl (pH 8.8), 1.0 M Tris-HCl (pH 6.8), 10% Sodium Dodecyl Sulfate (SDS), N,N,N’,N’-Tetra-methyl ethylenediamine (TEMED, Bio-Rad, 161-0801), 10% ammonium persulfate (Bio-Rad #161-0700), 30% acrylamide and bis-acrylamide solution at 29:1 (Bio-Rad, 1610156), urea (VWR, BDH4214-500G), pre-cast 4%-20% gradient gel (Bio-Rad #456-1096) PVDF membrane (Millipore, Immobilon-FL Transfer Membranes IPFL00010), membrane blocking agent, SeaBlock (ThermoFisher, #37527), and total protein staining solution (REVERT Total Protein Stain kit, LI-COR Inc., #926-11010), Pyronin Y (Sigma-Aldrich #P9172).
Protein concentration determination
PierceTM bicinchoninic acid (BCA) protein assay kit (Thermo Scientific) (UB276872).
Enzyme-linked immunosorbent assay commercial kit for quantifying proteasome
Enzo 20S/26S Proteosome enzyme-linked immunosorbent assay (ELISA) Kit (Catalog #BML-PW0575-0001).
Software
Image Studio Lite (Ver. 4.0) for image analyses. This software is part of Odyssey (LI-COR) image analyzer. An online-based free statistics calculator was used for statistical analysis (https://www.danielsoper.com/statcalc/calculator.aspx?id=47).
Experimental apparatus
Sonic dismembrator (Fisher Scientific, Model: XL2000-350); Table top centrifuge (Eppendorf, Model: 5418); Odyssey Infrared Imager (Model: 9120, LI-COR Inc., 4308 Progressive Ave. Lincoln, Nebraska 68504); Mini Protean III Electrophoresis system (Bio-Rad 165-3301); Electro transfer system (Mini Trans-Blot Electrophoretic Transfer Cell Bio-Rad 170-3930); and Multi-well plate reader (Bio-Tek Cytation 5 or Bio-Tek Synergy HT).
Procedures
SDS polyacrylamide gel electrophoresis and Western blotting
The cytosolic proteins of platelet lysates form AD patients and control subjects were separated on a homemade 4%-12% gradient gel with 1.5-mm width 20-well plate, MINI Protean II casted gel, using sodium dodecyl sulfate polyacrylamide gel electrophoresis (SDS-PAGE). The apparatus was filled with 1× electrophoresis buffer. With the gel inside the buffer-containing cell, each lane was loaded with pyronin Y lane marker and 30 µg total protein (1 mg/mL) Electrophoresis was performed at 75 V for an average of 100 min until front dye (Pyronin Y) was at the bottom of the gel. The gel was removed from the sandwiched plates and processed for protein transferring to a methanol-activated polyvinylidene difluoride (PVDF) membrane. Electro-transfer process was carried out at 75 V for 30 min. The transfer buffer did not include methanol. The low temperature of the transfer unit was maintained by either inserting an ice-block or placing the transfer unit in an ice-filled container. The PVDF membrane was then stained for total protein visualization by total protein staining kit (REVERT, Total Protein Stain Kit LI-COR Inc., 926-11010). Transferred proteins were imaged by Odyssey (LI-COR) imaging system at the 700 nm set channel. The staining step was optionally removed by incubating with REVERT reversal solution for a maximum of 10 min as per protocol provided by the manufacturer. Finally, the membrane was rinsed twice with nanopure water. The membrane was blocked in 2 mL of 1:1 SeaBlock/TBS buffer for 1 h at room temperature (RT) on an orbital shaker. The membrane was directly transferred to a container with 10 mL of 1:1 SeaBlock/TBST and primary antibody dilution at 1:500 or 1:1000 while incubating on an orbital shaker for overnight at 4 °C. The next day, the membrane was washed with 1× TBST for 20 min and then incubated with horseradish peroxidase conjugated secondary antibody, goat anti-mouse (LC3), and goat anti-rabbit (P62, Beclin-1, and Atg5-12) at 1:10,000 dilution for 1 h at RT on an orbital shaker. An additional 20-min wash with 1× TBST was performed to remove unbound antibodies before imaging was completed. The membrane was scanned by Odyssey (LI-COR) imager and analyzed by densitometric quantification using Image Studio Lite (Ver. 4.0).
The 26s/20s proteasome analysis by ELISA method
Initial proteasome assay conditions were optimized in platelets obtained from Kansas City Community Blood Center (KCCBC). Three sample fractions (i.e., whole platelet lysate, clear supernatant, and membranous pellet) were analyzed by proteasome ELISA kit to identify which fraction better represents the proteasome protein profile. Forty-microgram protein samples per well were used in ELISA. The assay procedure was performed according to the manufacturer provided protocol. Absorbance was read at 450 nm wavelength using a multi-well plate reader (Bio-Tek, Synergy HT). A standard curve was established and slope of the curve was used to determine the concentration of unknown sample proteasome 26s/20s.
Statistical analyses
The quantitative analysis for Western blots was performed using Image Studio Lite software program (Ver. 4.0) The quantitative values of autophagy protein markers represent arbitrary units based on the intensity of the bands. Statistical analyses were performed by a two-tailed unpaired student t-test and Mann-Whitney U test. This was coupled with calculating the value of Cohen’s d and the effect-size correlation, r, using the means and standard deviations of two groups (AD and control). Error bars on all data represent standard error of the mean (± SEM).
Results
We tested a battery of antibodies for probing autophagy proteins purchased from several vendors and compared them to each other for selecting the best working antibodies. Individual platelet lysate samples from AD and control group (n = 9) were analyzed by Western blotting technique using selected antibodies. The results from three replicates were averaged and independently tested as an interval type of data. We only found an increase of LC3-I (P ≤ 0.02) in AD when compared to Control [Figure 2]. The select autophagosome target proteins appeared to be elevated; however, there was no statistical difference between AD patients and control group, except for LC3-I.
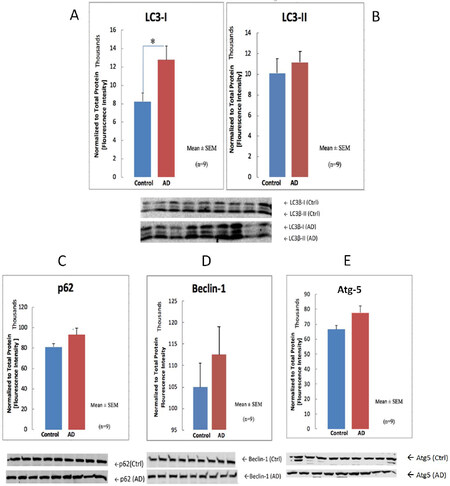
Figure 2. Autophagy target protein profiles in human AD and in non-demented (control) platelet cytosols. LC3-I, LC3-II, and Atg5 proteins were probed using antibodies from MBL vendor. Beclin-1 was detected using Cell-Signaling antibody, and the p62 protein was detected using Sigma-Aldrich antibody. Each sample was analyzed three times and Mean ± SEM is presented. The protein band intensities were normalized to total protein staining. Student t-test was employed and only LC3B-1 showed significance (P ≤ 0.02). AD: Alzheimer’s disease
The proteasome concentrations of platelet lysates from AD and age-matched control subjects (n = 12) were assessed by ELISA method. Although AD patient platelet lysate proteasome levels were elevated, no statistical difference between patient and control group was obtained [Figure 3].
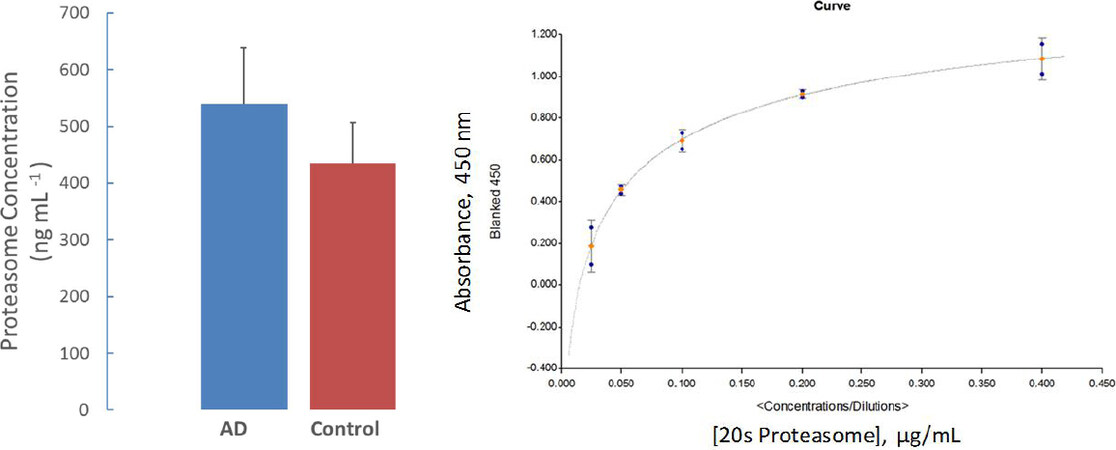
Figure 3. Proteasome concentration measurements in whole platelet lysate. The bar graph represents the proteasome concentration in whole platelet lysate obtained from AD and control subjects (Mean ± SEM; n = 12). Although an increased proteasome protein profile was observed in AD samples, no statistical importance was obtained. The inset figure shows a typical standard curve for quantifying proteasome 20s concentrations. AD: Alzheimer’s disease
Discussion
Aβ1-42 is widely understood to accumulate in the early stages of the AD pathology. This malfunctioning protein recruits and triggers microglial, astrocyte facilitated clearance, but soon Aβ1-42 depositions overwhelm the response leading to microglia-mediated neuroinflammation[14-16] Aβ1-42 also stimulates the catalysis by NADPH oxidase. This enzyme activity increases reactive oxygen species production. The presence of these harmful chemicals activates Atg4, which cleaves and lipidates LC3-I with phosphoethanolamine, as part of the induction of the autophagic pathway. Since AD is a multi-faceted disease, somehow the proteolytic system is suppressed due to downregulation[2,6], allowing for the characteristic extracellular amyloid plaques and neurofibrillary tangles to develop.
Some reports also recently discovered that platelets contain a proteolytic system by which hemostasis and thrombosis is acquired[17,18]. Since we have shown that an elevation of pathological pTDP43 within the platelet cytosol is correlated to hippocampal cortex of AD patients[13], it was imperative that we analyze these platelet proteolytic systems. We attempted to establish any change of the protein concentrations of proteolytic system, since platelet proteasome concentrations have not been reported prior to our studies. We were unable to assess matching brain tissue proteasome profiles from the subjects due to impracticality of obtaining brain biopsy tissue from living patients and the control cohort. In a follow-up study, we will consider including post-mortem brain tissues and matching platelet samples from the same individuals. This approach would provide better connection between brain and platelet proteasome profile. Nevertheless, it was initially hypothesized that, based on the aforementioned reports, the proteolytic system is somehow altered, and that we would expect to observe some degree of variations in proteasome concentrations.
We employed certain autophagy marker antibodies (i.e., Beclin-1, Atg5, p62, and LC3) to assess the autophagy target proteins in platelets. This was in reference to previous autophagy activity measurements by Gupta et al.[17]. The antibodies from multiple manufacturers have different affinities for a given sample. Series of antibody dilutions and platelet sample concentrations were optimized to match the best antibody-protein combination to be used in the assays. Those results suggested 30-μg whole platelet lysate proteins paired with a primary antibody dilution of 1:1000 would be ideal for future analysis.
We evaluated only LC3A and LC3B antibodies in Western blotting. We found that anti-LC3B antibody did not detect a target protein in human platelet lysate samples. Other researchers have stated that, out of the three possible isoforms (LC3A, LC3B, and LC3C), LC3A and LC3B autophagosome components exhibit distinct expression patterns in different human tissues[19]. After the final measurement of three replicates, the only notable results found were the proteins levels of LC3-I (a cleaved form of LC3). LC3-II (lipidated LC3-I) is a conjugated protein marker for platelet autophagy system[20]. Since there was no change in levels of LC3-II, the difference in LC3-I between the groups (P ≤ 0.021) could be the result of the autophagic pathway being blocked in its initial steps in AD[21]. The overarching implication we believe is that in AD, probably to alleviate aggregate stress, platelet allocated autophagy may be functionally upregulated and induced but inhibited in early or late steps of the pathway[20]. Our results seem to be inconclusive at this stage based on exclusively LC3 immunoblotting results. The immunoreactivity of LC3-I and LC3-II are different. LC3-II tends to be more sensitive to antibodies[21]. A stimulated autophagic pathway is represented by reduction of autophagy marker LC3II. Thus, when we found that there was no change in LC3-II, it is more indicative of no detection of flux than the changes of LC3-I. Therefore, an autophagy activity analysis assessment should be performed in freshly isolated intact platelets in a follow-up study.
We assessed the proteasome concentration in platelet lysates. Proteasome 20S protein levels were measured by ELISA techniques in cell lysates, supernatants, and pellets in KCCBC obtained healthy samples in the initial phase of these studies. We relied on supernatant isolations of platelet lysates to measure AD profiled proteasome concentrations. We found no statistical difference (P = 0.373) between AD patients and age-matched control subjects in these platelet samples based on a two-tailed, student t-test and Mann-Whitney U test.
To effectively assess the relationship of platelet proteolytic machinery protein levels in AD patients, rather than the use of only “P” values, we incorporated effect sizes into our data analysis[22,23]. In addition to selecting a student t-test (interval, parametric), we also employed the Mann-Whitney (ordinal, non-parametric) level of measurement. This was justified by the expression of a large variation in protein concentrations between individual samples within each group. This means our sample did not meet the parametric assumption of equal variances. This adjustment ascribed the data into ranked categories before comparing the median values between the groups.
Despite the statistical insignificance between the two group’s means of Atg5, p62, and Beclin-1, a measure of strength of effect points may be more meaningful. Moderate to large standard deviations (SD = 0.41-1.0) and correlations (r = 0.36-0.44) between AD patients and controls were detected, denoting a probability that there is a difference in autophagic pathway protein levels. Our sample size was not large enough to produce statistical significance. On the other hand, the insignificance found between AD and control regarding LC3-II protein bands, coincided with a small magnitude of effect between groups. (SD = 0.27, r = 0.13, P = 0.58) [Figure 1B] In the proteasome concentration profile assay, we observed a statistical insignificance with a small group effect (SD = 0.34, r = 0.17, P = 0.373).
In this study, there are some caveats and setbacks, rendering our results with a low difference. First, our continuous and averaged data comparison was statistically insignificant for all except one based on our sample cohort (n = 9 for autophagosome and n = 12 proteasome analyses). As mentioned above, human biological samples have a substantial variation in concentration and effect between each sample and group measurements. Especially with a small effect size for the main autophagy monitor, LC3-II, increasing the n value to ~220 per group (n = 220) should produce a significant t-test at a probability level of 0.05 for all samples[24]. Secondly, as it has been reported that LC3-I is unstable and sensitive to freezing-thawing cycles or SDS buffered cocktail[25], future samples should be freshly assessed and not exposed to a repeated freeze-thaw cycle. Thirdly, immunoblotting has its limitation for determining autophagic fluctuations. As we understand that LC3-II is the go-to marker, an increase in concentration could be due to correlation with autophagosome accumulation, but autophagic flux is not guaranteed[26]. In more relevance to AD neuropathology, beclin-1 is downregulated in this disease; however, LC3-II can still form without a phagophore on ectopic membrane fragments[21,25]. Beclin-1, an adaptor protein via its partner proteins, can either stimulate or suppress the onset of autophagy[27]. In this study, we observed that beclin-1 levels were elevated in AD patient’s platelet. We are unable to offer an explanation of the beclin-1 behavior, because we do not know the autophagy activity profile at this stage.
It is known that a neurodegenerative condition such as AD affects the periphery by increase in thrombin and von Willebrand factor (vWF) protein. Thrombin and vWF are platelet activators[18]. In AD, patients are known to express an increased amount of vWF, which is partially used to convert quiescent platelets into activated platelets[28]. Hence, activated platelets of these patients produce and release more Aβ into circulation compared to controls[29]. Aβ usually interacts with fibrin, thereby promoting coagulation and fibrin aggregation. Therefore, an increase of Aβ could mean an increase in platelet aggregation that implies an alternate flux in hemostasis. We did not analyze Aβ peptide levels in platelet lysates of AD patients and age-matched control subjects in this study; however, we plan to include the platelet lysate Aβ1-42 measurements in a follow-up study.
Since our results are supposed to be a testament of basal autophagy in quiescent platelets, AD derived samples might have already been activated when obtained from the patients. Activated platelets have increased autophagic pathway activity[18]. Therefore, the significant measurements might be due to that previous condition. One of the ways to normalize this variable would be to activate the control platelets before any protein concentration measurements. An alternative approach would be to inhibit the platelet activation factor by including an inhibitor (PGI2) during the platelet isolation from whole blood. Platelet proteolytic system analysis has allowed us to differentiate probable proteostasis between AD patients and controls in a cross-sectional fashion. One of the possibilities that can be discerned from our study is that there may be elevated induction of autophagy, beyond basal amount.
In light of this information, the platelet autophagic profile may be similar to neurons of this disease profile. This study was meant to extrapolate the extent to which AD can influence the state of these systems during an elevated presence of disease-related proteins. Autophagy flux and proteasome assessment in intact platelet are necessary for obtaining more conclusive evidence. A similar cross-sectional study with a few adjustments should be considered before testing other neurodegenerative disease groups in a similar fashion.
Declarations
Authors’ contributionsMade substantial contributions to conception and design of the study and performed data analysis and interpretation: Muriu RG
Performed data acquisition, as well as provided administrative, technical, and material support: Sage JM
Conceptualized the study, analyzed the data, and wrote the manuscript: Agbas A
Availability of data and materialsNot applicable.
Financial support and sponsorshipResearch reported in this publication was supported by several pilot project funds from QS85523J, University of Kansas Medical Center Research Institute, Inc. (QS85523J), FONTIERS-Trail Blazer Award (01-2429-001) and KCU intramural grants. The authors have no other relevant affiliations or financial involvement with any organization or entity with a financial interest in or financial conflict with the subject matter or materials discussed in the manuscript apart from those disclosed. No writing assistance was utilized in the production of this manuscript.
Conflicts of interestAll authors declared that there are no conflicts of interest.
Ethical approval and consent to participateThe authors state that they have obtained appropriate institutional review board approval (KUADC#11132) or have followed the principles outlined in the Declaration of Helsinki for all human or animal experimental investigations. In addition, for investigations involving human subjects, informed consent has been obtained from the participants involved.
Consent for publicationNot applicable.
Copyright© The Author(s) 2020.
REFERENCES
1. Tuite MF, Melki R. Protein misfolding and aggregation in ageing and disease: molecular processes and therapeutic perspectives. Prion 2007;1:116-20.
2. Ghavami S, Shojaei S, Yeganeh B, Ande SR, Jangamreddy JR, et al. Autophagy and apoptosis dysfunction in neurodegenerative disorders. Prog Neurobiol 2014;112:24-49.
3. Klionsky DJ. Autophagy: from phenomenology to molecular understanding in less than a decade. Nat Rev Mol Cell Biol 2007;8:931-7.
4. Meijer AJ, Codogno P. Autophagy: regulation and role in disease. Crit Rev Clin Lab Sci 2009;46:210-40.
6. Pickford F, Masliah E, Britschgi M, Lucin K, Narasimhan R, et al. The autophagy-related protein beclin 1 shows reduced expression in early Alzheimer disease and regulates amyloid beta accumulation in mice. J Clin Invest 2008;118:2190-9.
7. He C, Bassik MC, Moresi V, Sun K, Wei Y, et al. Exercise-induced BCL2-regulated autophagy is required for muscle glucose homeostasis. Nature 2012;481:511-5.
8. Gadhave K, Bolshette N, Ahire A, Pardeshi R, Thakur K, et al. The ubiquitin proteasomal system: a potential target for the management of Alzheimer’s disease. J Cell Mol Med 2016;20:1392-407.
9. Keck S, Nitsch R, Grune T, Ullrich O. Proteasome inhibition by paired helical filament-tau in brains of patients with Alzheimer’s disease. J Neurochem 2003;85:115-22.
10. van Leeuwen FW, de Kleijn DP, van den Hurk HH, Neubauer A, Sonnemans MA, et al. Frameshift mutants of beta amyloid precursor protein and ubiquitin-B in Alzheimer’s and down patients. Science 1998;279:242-7.
11. Chen X, Petranovic D. Role of frameshift ubiquitin B protein in Alzheimer’s disease. Wiley Interdiscip Rev Syst Biol Med 2016;8:300-13.
12. Feng W, Chang C, Luo D, Su H, Yu S, et al. Dissection of autophagy in human platelets. Autophagy 2014;10:642-51.
13. Wilhite R, Sage JM, Bouzid A, Primavera T, Agbas A. Platelet phosphorylated TDP-43: an exploratory study for a peripheral surrogate biomarker development for Alzheimer’s disease. Future Sci OA 2017;3:FSO238.
14. Kinney JW, Bemiller SM, Murtishaw AS, Leisgang AM, Salazar AM, et al. Inflammation as a central mechanism in Alzheimer’s disease. Alzheimers Dement (N Y) 2018;4:575-90.
15. Hickman SE, Allison EK, El Khoury J. Microglial dysfunction and defective beta-amyloid clearance pathways in aging Alzheimer’s disease mice. J Neurosci 2008;28:8354-60.
16. Rothhammer V, Quintana FJ. Control of autoimmune CNS inflammation by astrocytes. Semin Immunopathol 2015;37:625-38.
17. Gupta N, Li W, Willard B, Silverstein RL, McIntyre TM. Proteasome proteolysis supports stimulated platelet function and thrombosis. Arterioscler Thromb Vasc Biol 2014;34:160-8.
18. Ouseph MM, Huang Y, Banerjee M, Joshi S, MacDonald L, et al. Autophagy is induced upon platelet activation and is essential for hemostasis and thrombosis. Blood 2015;126:1224-33.
19. He H, Dang Y, Dai F, Guo Z, Wu J, et al. Post-translational modifications of three members of the human MAP1LC3 family and detection of a novel type of modification for MAP1LC3B. J Biol Chem 2003;278:29278-87.
20. Zhang XJ, Chen S, Huang KX, Le WD. Why should autophagic flux be assessed? Acta Pharmacol Sin 2013;34:595-9.
22. Lakens D. Calculating and reporting effect sizes to facilitate cumulative science: a practical primer for t-tests and ANOVAs. Front Psychol 2013;4:863.
23. Nakagawa S, Cuthill IC. Effect size, confidence interval and statistical significance: a practical guide for biologists. Biol Rev Camb Philos Soc 2007;82:591-605.
24. Sullivan GM, Feinn R. Using effect size-or why the P value is not enough. J Grad Med Educ 2012;4:279-82.
25. Klionsky DJ, Abeliovich H, Agostinis P, Agrawal DK, Aliev G, et al. Guidelines for the use and interpretation of assays for monitoring autophagy in higher eukaryotes. Autophagy 2008;4:151-75.
26. Gimenez-Xavier P, Francisco R, Platini F, Pérez R, Ambrosio S. LC3-I conversion to LC3-II does not necessarily result in complete autophagy. Int J Mol Med 2008;22:781-5.
27. Guan ZF, Zhou XL, Zhang XM, Zhang Y, Wang YM, et al. Beclin-1- mediated autophagy may be involved in the elderly cognitive and affective disorders in streptozotocin-induced diabetic mice. Transl Neurodegener 2016;5:22.
28. Peyvandi F, Garagiola I, Baronciani L. Role of von Willebrand factor in the haemostasis. Blood Transfus 2011;9 Suppl 2:s3-8.
Cite This Article
Export citation file: BibTeX | RIS
OAE Style
Muriu RG, Sage JM, Agbas A. Platelet proteolytic machinery assessment in Alzheimer's disease. J Unexplored Med Data 2020;5:2. http://dx.doi.org/10.20517/2572-8180.2019.08
AMA Style
Muriu RG, Sage JM, Agbas A. Platelet proteolytic machinery assessment in Alzheimer's disease. Journal of Unexplored Medical Data. 2020; 5: 2. http://dx.doi.org/10.20517/2572-8180.2019.08
Chicago/Turabian Style
Muriu, Roy G., Jessica M. Sage, Abdulbaki Agbas. 2020. "Platelet proteolytic machinery assessment in Alzheimer's disease" Journal of Unexplored Medical Data. 5: 2. http://dx.doi.org/10.20517/2572-8180.2019.08
ACS Style
Muriu, RG.; Sage JM.; Agbas A. Platelet proteolytic machinery assessment in Alzheimer's disease. J. Unexplored. Med. Data. 2020, 5, 2. http://dx.doi.org/10.20517/2572-8180.2019.08
About This Article
Copyright

Data & Comments
Data
0

 Cite This Article 1 clicks

 Like This Article 0
likes
Like This Article 0
likes


Comments
Comments must be written in English. Spam, offensive content, impersonation, and private information will not be permitted. If any comment is reported and identified as inappropriate content by OAE staff, the comment will be removed without notice. If you have any queries or need any help, please contact us at support@oaepublish.com.