
Development and applications of acquisition techniques for rat pancreatic imaging at clinical scanners

Abstract
Rat models are frequently used in preclinical studies on the pancreatic diseases. However, non-invasive imaging of rat pancreatic models has been hampered by the small size of the pancreas and the unpredictable motion artifacts in rat abdomen. Being widely accessible and of translational advantages, clinical magnetic resonance imaging (MRI) scanners have shown a great potential for small animal imaging studies. In this overview article, by combining clinically available hardware and imaging protocols, different technical challenges for rat pancreatic imaging on clinical MRI settings are addressed, and solutions for practical problems are elaborated. Consequently, state-of-the-art clinical MRI techniques can be translated to non-invasive small animal pancreatic imaging with high flexibility, incorporating high-resolution 3D structural imaging, magnetic resonance cholangiopancreatography, T1/T2 relaxation mapping, diffusion-weighted imaging and dynamic contrast-enhancement perfusion protocols. Images of rat models of pancreatic and hepatic tumors and acute pancreatitis are used for illustrations.
Keywords
Introduction
Developing an optimized diagnostic imaging platform by using clinical imagers has a great value for preclinical theragnostic research on small animals with pancreatic diseases. Due to the wide accessibility and translational relevance, the potential of clinical magnetic resonance imaging (MRI) scanners have been recently explored for rodent brain imaging and even small animal self-gated cardiac imaging[1,2]. However, most of those studies need customized hardware or MRI pulse sequences. Furthermore, imaging rodent pancreas proves extremely difficult due to the minute anatomical structures and random motion artifacts from the abdomen[3]. To tackle such technical challenges for rodent pancreatic imaging with clinical facilities, serial efforts have been made to provide solutions to these practical problems[4-6]. Experiments on rodent pancreatic imaging were carried out systematically from ex vivo organ contrast enhancement to noninvasive in vivo multi-parametric MRI. The following detailed objectives were identified: (1) to visualize a complete pancreas and its topographic landmarks through contrast enhanced CT and MRI in a rat postmortem model; (2) to explore noninvasive MRI methods for characterization of chemically induced acute pancreatitis in rats; (3) to estimate the reliability of 3D isotropic MRI and quantitative multi-parametric MRI for characterization of an orthotopic pancreatic head tumor model in rats; and (4) to validate the above newly developed imaging platform for preclinical and translational theragnostic studies on typical pancreatic pathologies in rats[7].
In this article, the above-mentioned research activities are overviewed. In particular, by combining standard clinical hardware with a small animal triggering system and MRI protocols modified from clinical imaging acquisition sequences, technical issues and challenges related to rat pancreatic imaging are discussed, and solutions to practical problems are proposed accordingly. All illustrated animal images were acquired at a 3.0T Siemens Trio or Prisma scanner with standard specifications.
Hardware specifications and limitations
Regarding the clinical standard hardware, the applied 3.0T Siemens Trio and Prisma scanners have a peak gradient amplitude of 45 mT/m and 80 mT/m respectively, with the same slew rate of 200 T/m/s. Such gradient strengths are about 10 times lower than that of the current state-of-the-art small animal MRI scanners. In rodent abdominal MRI, commercial human wrist multi-channel surface coils are most frequently used for receiving the MR signals[1,8-10]. A small field of view (FOV) around 70 to 80 mm, adapted to the tiny dimension of the rat abdomen, would be preferred. Although multi-channel wrist coils allow scanning in a smaller FOV, the signal-to-noise-ratio (SNR) will be sacrificed. To maintain enough signal, more scanning averages would be necessary in most cases, which lead to a prolonged scan duration. Alternatively, SNR can be improved by lowering the receiver bandwidth or image resolution. However, lower receiver bandwidth would induce longer echo spacing, an increased chemical shift, longer minimal repetition time (TR) and more severe susceptibility artifacts[11]. Since rodent anatomical structures are much smaller compared to that of human subjects, it is crucial to maintain sufficient spatial resolution. Therefore, a compromise has to be made among SNR, spatial resolution and temporal resolution.
Challenges of rodent pancreatic imaging
The major challenges of rodent pancreatic imaging are the motion artifacts caused by periodical diaphragm movement during respiration and spontaneous peristaltic movement of the gastrointestinal (GI) tract. Regular breathing can be censored by using a small animal monitoring system. However, randomized GI movement is usually unpredictable, and would accumulate to disrupt the images. As shown on the cine images in Supplementary Figure 1, highly active peristalsis and contraction in the GI tract surrounding the rat pancreas would induce both regional in-plane and through-plane motion artifacts. Therefore, to minimize accumulated random motion artifacts, it is necessary to accelerate each scan protocol. The second challenge for rodent pancreatic imaging is the poor field homogeneity at the tissue boundaries in abdominal region, which may hamper the use of protocols based on echo planar imaging (EPI) and balanced steady-state free precession methods due to their sensitivity to susceptibility changes, resulting in artifacts. Different specific image artifacts will be discussed in following chapters.
Respiration control during scans
Due to the relatively low temporal resolution in most MRI scans, respiration control is essential for rat abdominal imaging. Currently, most imaging protocols for human abdominal region are performed under breath-holding condition[12], which is hardly applicable in small animals. Tracheal intubation is an alternative to breath-holding method[13], however this time-consuming and device-demanding setup is not ideal for small animal scans. In small animal scanners, retrospective gating or prospective acquisition correction using scout scans is helpful to eliminate respiratory and cardiac artifacts[14]. Similar navigation system is available for a few protocols on clinical scanners[12], however, the navigation window in clinic scanner is too big for a small rat, which results in a low navigation efficiency and prolonged scan duration. To illustrate the navigation system, time series of rat abdominal imaging are projected in Figure 1A.
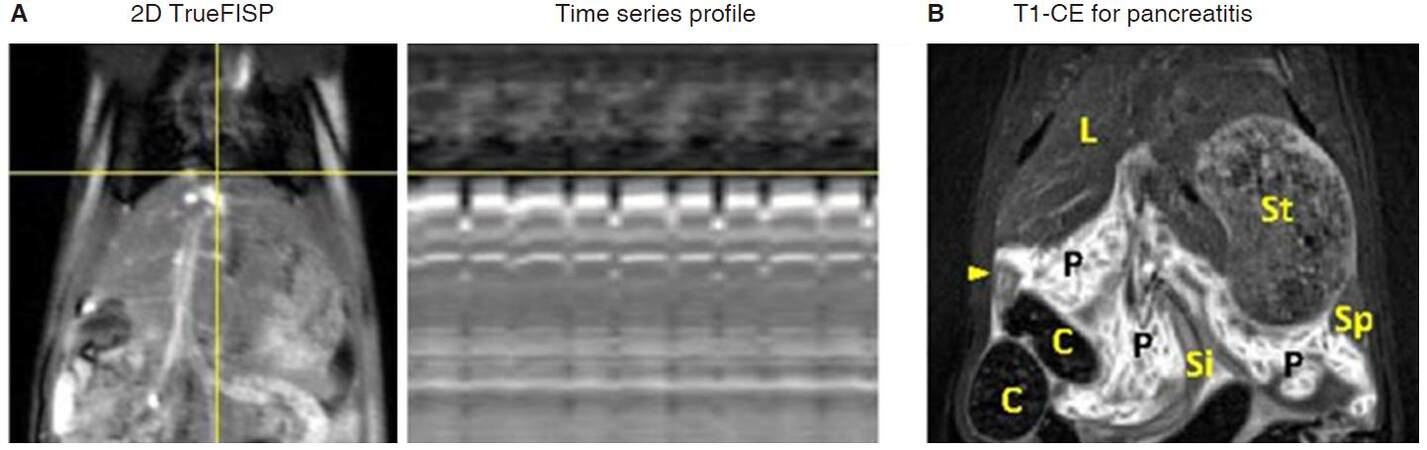
Figure 1. Two schemes of respiration control without external respiration triggering. A: Illustration for navigation scans. A navigation band can be placed over the dome of the liver, respiration motion is detected from corresponding projection of time series profile, and imaging acquisition is triggered or retrospectively reconstructed when motion is under customer defined acceptance ratio; B: in rat acute pancreatitis model, oversampled BLADE protocol can be applied for T1-weighted contrast-enhanced imaging, pancreatic lobes and surrounding tissues or organs are clearly depicted on image. FISP: fast imaging with steady state precession; C: colon; L: liver; P: pancreas; Si: small intestine; St: stomach; arrow head: duodenum
A relatively more efficient method for respiration control is the application of breath triggering using a small animal monitor system, which is also commonly used on preclinical small animal scanners. A respiration rate between 45 to 60 breaths per minute is suggested for rat abdominal imaging. On clinical MRI scanners, a few protocols can be combined with respiration triggering, and effective TR time is slightly prolonged due to long breath intervals. For spin-echo based T1-weighted images, a short TR is essential to maintain enough T1 weighting. In this case, free breathing scan with oversampled radial trajectory acquisition[15] blade (oversampled periodically rotated overlapping parallel lines with enhanced reconstruction) is an option for T1-weighted imaging [Figure 1B].
MRI acquisition
Detailed MRI parameters are summarized in Table 1. For in vivo MRI scans, isoflurane, air and oxygen mixture can be used for animal anesthesia[5,6]. Small animal monitor system model 1025T from SA instruments Inc. is compatible for respiration triggering[5,6]. To minimize accumulation of random artifacts in rat abdomen, all protocols are combined with parallel imaging acceleration (GRAPPA) and partial-Fourier. In case a single 2D measurement takes longer than 2 min, multiple measurements instead of multiple averaged acquisitions can be applied, and motion correction can be done via post-processing procedure.
In vivo MR sequence parameters for rat pancreatic imaging at 3T
| Protocol | 3D-T2W | 3D-T1W | 2D-T2W | 2D-T1W | T2 map | T1 map | DWI | DCE | ||||
|---|---|---|---|---|---|---|---|---|---|---|---|---|
| Sequence | SPACE | TrueFISP | MRCP | TFL | TrueFISP | BLADE TSE | SE | IR TFL | MOLLI | EPI SE | VIBE | MOLLI |
| TE (ms) | 134 | 2.98 | 256 | 2.66 | 3.74 | 45 | 24-echo | 2.84 | 2.07 | 90 | 2.46 | 2.07 |
| TR (ms) | > 1,500 | 420 | > 2,000 | 447 | 398 | 400 | > 1,500 | > 3,000 | 353 | > 2,500 | 7 | 353 |
| Matrix | 192*192*112 | 174*208*64 | 198*192*60 | 164*192 | 179*224 | 192*192 | 172*256 I | 128*92 | 256*192 I | 130*78 | 128*86*10 | 256*192 I |
| Resolution (mm) | 0.39*0.39*0.38 | 0.38*0.38*0.38 | 0.39*0.39*0.38 | 0.44*0.44*0.8 | 0.33*0.33 | 0.39*0.39 | 0.33*0.33 | 0.66*0.66 | 0.29*0.29 | 0.69*0.69 | 0.66*0.66*2 | 0.29*0.29 |
| Plane | Coronal | Coronal | Coronal | Coronal | Coronal/axial | Coronal | Coronal | Axial | Axial | Axial | Coronal | Axial |
| Average | 1.4 | 2 | 3.4 | 2 | 2 | 300% blade | 2 measures | 2 | 4 measures | 2 | 1 | 1 |
| Flip angle(°) | Variable | 40 | 120 | 20 | 60 | 150 | 180 | 5 | 35 | 90 | 15 | 35 |
| Fat saturation | On | On | On | Off | Off | On | Off | Off | Off | On | Off | Off |
| Bandwidth (Hz/pixel) | 260 | 300 | 347 | 260 | 300 | 350 | 500 | 390 | 500 | 755 | 445 | 500 |
| Scan duration | 11-14 min | 4-5 min | 4-6 min | 1:15 min | 10 s | 39 s per slice | 4-5 min | 1:(20-2) min | 80 s | (2-3):30 min | 5:30 min | 20 s per frame |
T2-weighted protocols
In both clinical and preclinical studies, T2-weighted sequences are most commonly used for anatomical assessment. Although it is almost impossible to distinguish rat pancreas from surrounding tissue using conventional MRI protocols, pancreatic landmarks can be easily depicted from high-resolution 3D images[4]. T2-weighted 3D SPACE (turbo spin-echo or TSE with variable-flip-angle refocusing RF pulses) and TrueFISP (fast imaging with steady-state pre-cession) sequences are the most commonly used T2 protocols in clinic[12]. In our experimental setups, a 0.39 mm isotropic 3D SPACE scan takes about 11-14 min, while the 3D TrueFISP protocol can be finished within 5 min. However, due to the complex environment of rat abdomen, TrueFISP images always suffer from susceptibility artifacts [Figure 2]. To avoid aliasing artifact, SPACE images are always obtained with coronal scans, transversal and sagittal views can be reconstructed from 3D data. Volumetric TrueFISP scan allows a smaller FOV along the slice direction [Figure 2A, lower right]. A single slice 2D TrueFISP image can be finished in 10 s (2 averages) with a superior SNR in both coronal and transversal slices [Figure 2B]. However, in case that the colon is closely adjacent to pancreatic head tumor, tumor signal could be disrupted by banding artifact [Figure 2B, lower right]. Therefore, in pancreatic head tumor studies, SPACE protocol would be suggested as the standard structural imaging, especially in longitudinal studies [Figure 3].
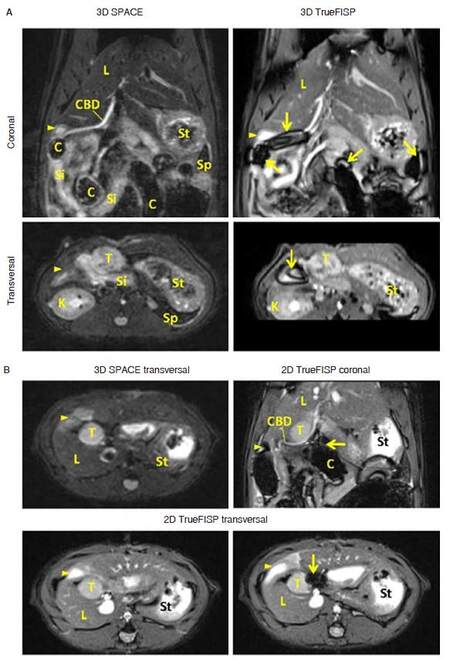
Figure 2. T2-weighted images for the rat bearing pancreatic head tumor. A: Isotropic 3D images are able to provide detailed anatomical information for rat abdomen. Common bile duct with full length is easily depicted from coronal view. Severe banding artifacts (arrows) are noticed from 3D TrueFISP images in area with air-tissue boundaries; B: compared to transversal image reconstructed from 3D SPACE, 2D TrueFISP images provide higher signal-to-noise-ratio. But in case that pancreatic head tumor is adjacent to colon, banding artifact would disrupt image signal around the tumor. FISP: fast imaging with steady state precession; C: colon; CBD: common bile duct; K: kidney; L: liver; Si: small intestine; St: stomach; T: tumor; arrow: susceptibility artifact; arrow head: duodenum
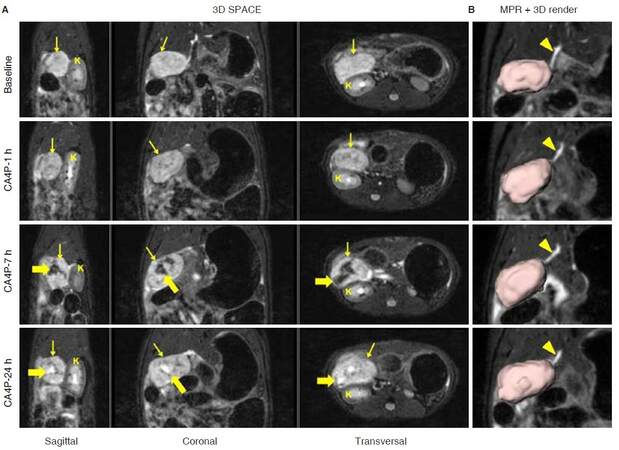
Figure 3. Non-invasive longitudinal follow up using 3D T2-weighted SPACE in a rat study on tumors, where an orthotopic pancreatic head tumor (thin arrow) was treated with a vascular disrupting agent CA4P. A: Intra-tumoral hemorrhage was presented as hypo-intense signal (thick arrow) after 7-h of CA4P injection, and hyper-intense necrosis core (thick arrow) was detected from SPACE images 24-h after treatment; B: corresponding MPR images clearly indicate the relationship between common bile duct and tumor, which is presented with volumetric rending. CA4P: combretastatin A4 phosphate; MPR: multiplanar reconstruction; K: kidney; arrowhead: common bile duct
In clinical practice, magnetic resonance cholangiopancreatography (MRCP) is a standard protocol for non-invasive check-up to the biliopancreatic duct system[12]. For rodent imaging, MRCP can be achieved from the SPACE protocol with heavy T2-weighting. An example of Caerulein induced acute pancreatitis (AP) model is shown in Figure 4, in which edematous pancreatitis tissue can be clearly detected from MRCP. Pancreatic tissue contrast is even higher than that shown on SPACE images [Figure 4B], thus providing more accurate volume estimation for edema[5].
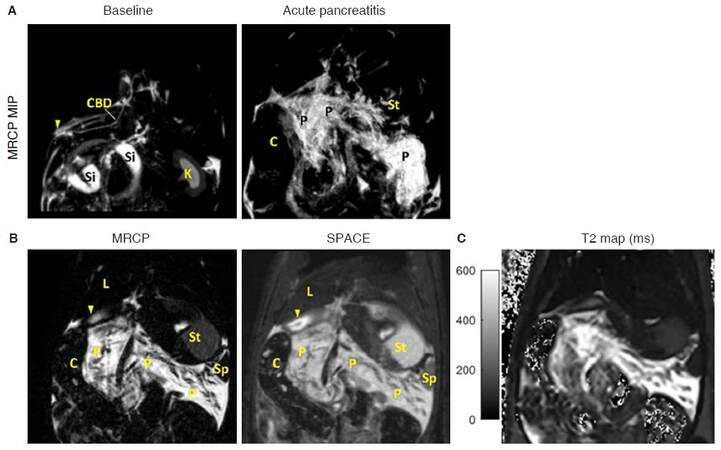
Figure 4. T2 images in a rat with Caerulein induced AP. A: MIP images of 3D MRCP sequence for baseline scan and 3-h after AP induction. Pancreas is not visible during baseline scan, while edematous pancreatitis is clearly shown 3-h after the onset of AP; B: MRCP provides better contrast for hyper-intense edematous tissue compared to 3D SPACE image, while pancreatic glandular lobules appear hypo-intense; C: corresponding T2 relaxation map for edematous pancreatitis. MIP: maximum intensity projection; MRCP: magnetic resonance cholangiopancreatography; AP: acute pancreatitis; C: colon; CBD: common bile duct; K: kidney; L: liver; P: pancreas; Si: small intestine; St: stomach; arrow head: duodenum
T1-weighted protocols
Without respiration triggering, standard spin-echo T1 protocol is not ideal for rat pancreatic imaging due to the sensitivity to motion artifact. Alternatively, oversampled BLADE protocol is more robust to overcome the motion artifacts, and can be finished in 40 s with 300% blade coverage [Figure 1B]. Gradient-echo based T1 protocols can be adjusted for contrast-enhanced assessment and volumetric measurement[4]. Pancreatic tumor volume can be obtained from 3D SPACE images, which provide clear anatomical information[6]. However, SPACE might not be the best protocol for volumetric measurement due to its long scan duration (over 10 min). On the other hand, combining with SPACE images, fast 3D T1-weighted turbo fast low-angle shot protocol might be an option for more accurate volume evaluation [Figure 5].
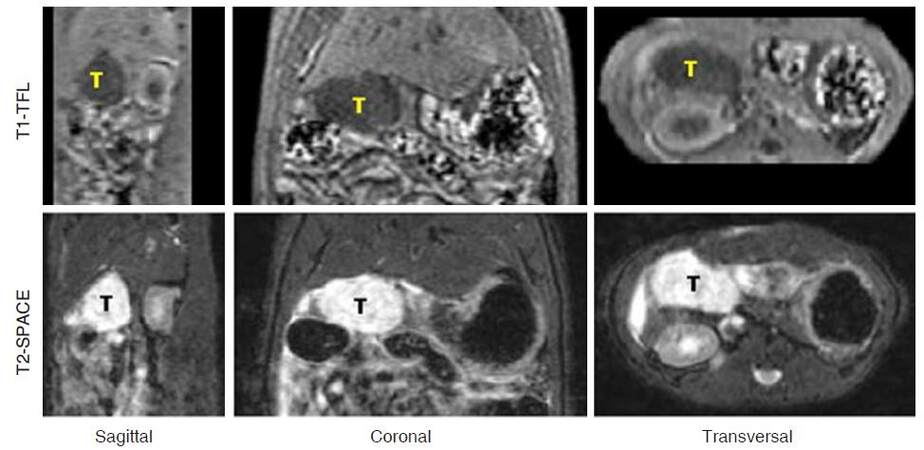
Figure 5. Volumetric measurement for pancreatic head tumor from 3D data. Upper: Fast T1-weighted TFL sequence can be finished in 80 s with 2 averages. Tumor is shown as hypo-intense mass due to its long T1 relaxation; Lower: corresponding anatomical images from T2-weighted SPACE show hyper-intense tumor mass. TFL: turbo fast low-angle shot
Relaxation times mapping
Quantitative analysis could provide more reliable information in multi-center and longitudinal studies[16]. Knowledge of tissue relaxation times is crucial for tissue characterization, can be helpful in optimization of MRI sequence parameters, and allows quantitative evaluations such as contrast agent uptake and iron overload[17,18]. Conventionally, standard transverse relaxation time (T2) mapping is obtained from multi-spin-echo pulse protocols, in which the T2 decay is sampled at different echo times[18]. Since the effective TR time in respiration triggered protocols is always longer than 1 s, a long echo train (16 to 24 echoes) could be used for multiple echo sampling. Gradient echo based T2* mapping protocols might suffer from susceptibility and off-resonance artifacts in rat abdominal region, due to the presence of gas and ferromagnetic materials in the GI tract [Figure 2].
For longitudinal relaxation time (T1) mapping, the time consuming gold standard spin-echo based inversion recovery (IR) method can be performed on phantom. The Look-locker and variable flip angle methods can be applied for fast T1 mapping, but those protocols are not always available on standard clinical scanners. Alternatively, groups of 2D single-shot or 3D segmented gradient-echo based IR protocols can be used for in-vivo T1 measurements in rat abdomen. To get an accurate T1 estimation, 7 to 9 recovery samplings covering the entire T1 range in abdomen are used in our experiments[6].
In pancreatic disease models (acute pancreatitis and pancreatic tumor), change of T2 relaxation mainly reflected the increase of water content or bleeding, presented as hyperintense necrosis [Figures 3A and 6A, CA4P-24 h] or edema [Figure 4C], and hypointense hemorrhage [Figure 6A, CA4P-7 h]. In our setups, native T1 mapping is less sensitive to tumor hemorrhage or necrosis [Figure 6B]. On the other hand, T1 mapping is essential for quantification of contrast agent uptake [Figure 7] and pharmacokinetic modeling [Figure 8].
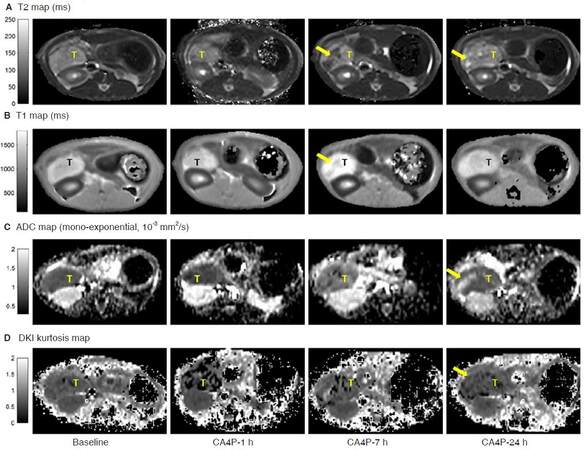
Figure 6. Quantitative relaxation mapping (A and B) and diffusion images (C and D) in rat orthotopic pancreatic tumor model. The tumor was treated with a vascular disrupting agent CA4P. After 7-h of CA4P intervention, acute hemorrhagic necrosis (arrow) resulted in a decreased T2 and diffusion kurtosis. At 24-h after treatment, intra-tumoral hemorrhage was absorbed, a necrosis core (arrow) was detected in areas with increased T2 and ADC value. CA4P: combretastatin A4 phosphate; ADC: apparent diffusion coefficient
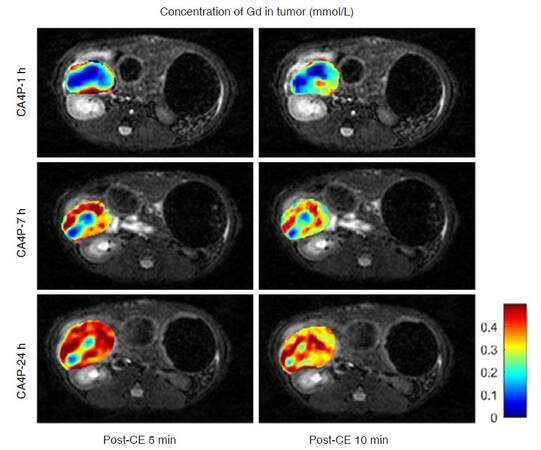
Figure 7. Uptake of contrast agent (Gd-DOTA) in pancreatic tumor after administration of a vascular disrupting agent CA4P. Concentration of Gd-DOTA was obtained from pre- and post-contrast (post-CE) T1 mapping. Vascular shutdown was clearly depicted 1-h after CA4P injection, and tumor was gradually re-perfused afterwards. CA4P: combretastatin A4 phosphate; Gd-DOTA: gadolinium-tetraazacyclododecane tetraacetic acid
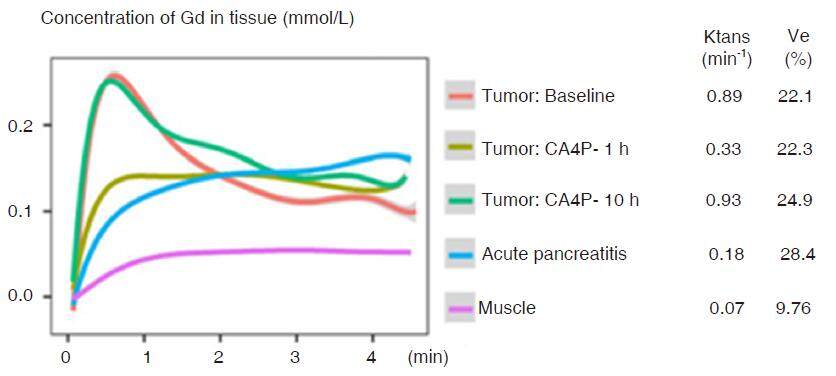
Figure 8. Dynamic contrast-enhanced experiments for pancreatic tumor and AP taking muscle as a reference. DCE was performed using gradient-echo protocol with a temporal resolution of 4.1 s. CTC were measured from region of tumor and edematous pancreatitis. Pancreatic tumor was characterized with rapid wash-in enhancement followed by fast wash-out phase, while edematous pancreatitis presented much slower and continuously uptake. Parameters calculated from standard Tofts model indicated a much lower transfer constant (Ktrans) and higher fraction volume (ve) in edematous pancreas, compared to pancreatic tumor. AP: acute pancreatitis; CTC: concentration-time-curves; DCE: dynamic contrast-enhanced
Diffusion weighted imaging
Diffusion weighted imaging (DWI) has shown the potential in monitoring therapeutic response in tumor studies[19,20]. Previously in most studies, apparent diffusion coefficient (ADC) value was simply obtained from mono-exponential model as an indicator of tissue diffusivity. In recent decades, other mathematical models have been developed in order to provide better data fitting[21]. Intravoxel incoherent motion (IVIM) model is one of the most popular methods, which reflects the tissue micro-capillary perfusion[22]. However, accurate estimation of the perfusion fraction requires multiple samplings for small b-values under 100 s/mm2. Alternatively, in oncological applications, kurtosis imaging focusing on sampling of b-values above 1,000 s/mm2 provides information about the heterogeneity and irregularity of tumor cellular environment[20]. In our pancreatic tumor study [Figure 6C and D], a maximum b-value of 2,500 s/mm2 was applied in trace-weighted imaging[6]. To improve SNR in diffusion measurements, more averages can be applied for high b-values. Due to the limited gradient strength on clinical scanners, the EPI readout is usually prolonged, which leads to geometrical distortion in phase direction[23]. Thus, a relatively higher bandwidth and parallel imaging technique would be necessary to achieve smaller echo spacing and faster readout.
Dynamic contrast-enhanced imaging
Dynamic contrast-enhanced (DCE) is helpful in evaluation of tissue vascularity, it provides physiological information such as blood flow and vessel permeability. The potential of applying DCE for diagnosing chronic pancreatitis and characterization of pancreatic tumor mass has been investigated in clinical studies[24,25]. Conventionally, gadolinium-based MRI contrast agents (CAs) are widely used for T1-weighted DCE experiments. Currently, low molecular weight gadopentetate dimeglumine gadoliniumdiethylenetriamine penta-acetic acid and gadoterate meglumine gadolinium-tetraazacyclododecanetetraacetic acid (Gd-DOTA) are among the most commonly used CAs[26]. On a clinical scanner, fast gradient-echo protocols can be used for dynamic measurement with high temporal resolution. Followed by native T1 mapping and baseline scans, a CA is given via bolus intravenous injection. Time-varying signals followed by the CA injection are recorded and converted to the concentration time curve (CTC) for quantitative assessment. Standard Tofts model is the simplest compartmental model, which describes the distribution of a CA in blood plasma and extravascular extracellular space, and intravascular distribution of the CA can be included in extended Tofts model.
Pharmacokinetic estimation using Tofts model requires the knowledge of arterial plasma concentration[27], which can be extracted from the blood signal of each subject. To obtain enough contrast for the arterial input function (AIF), previously gadobenate dimeglumine (Gd-BOPTA) was applied in our experiment for characterization of an orthotopic pancreatic tumor model[6]. Due to the relatively high relaxivity and long plasma half-life of Gd-BOPTA, AIF was easily obtained from aortic signal of each animal. While in short-term longitudinal study for tumor therapy, Gd-DOTA is suggested due to the fast blood clearance. However, individual AIF might be difficult to obtain due to reduced contrast compared to Gd-BOPTA under the same injection concentration. In such cases, population AIF or reference-region based method can be applied for pharmacokinetic modeling[28]. An example of region-of-interest based DCE experiment is shown in Figure 8, in which a population bi-exponential AIF[29] was applied for quantitative assessment in case of acute pancreatitis and pancreatic tumor therapy.
In our experimental setup, dynamic T1 mapping was investigated for pixel-wise DCE measurement, in which standard cardiac modified look-locker inversion recovery, separate license from Siemens, was modified for repeated T1 mapping using rat respiration signal as triggering. Scheme of dynamic T1 mapping is shown in Figure 9A. For each T1 mapping, 5 images are acquired after the first inversion, followed by 2-breaths break; then 3 images acquired after the second inversion. The next T1 measurement starts after 4-breaths break. In such way, a single T1 measurement can be finished in 14 breaths, resulting in a temporal resolution around 20 s in pixel-wise DCE experiment. Afterwards, the CTC curve can be directly extracted from dynamic T1 mapping for pharmacokinetic modeling [Figure 9B].
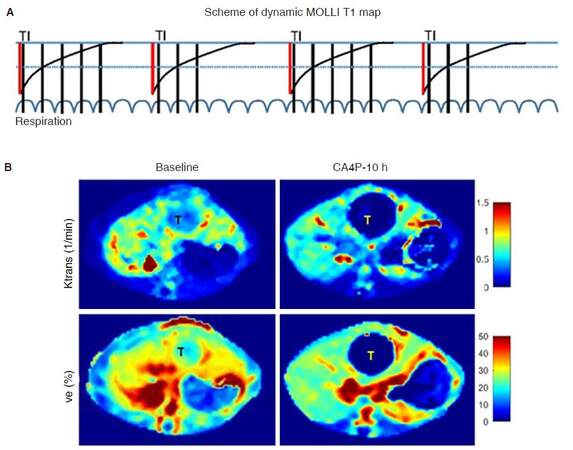
Figure 9. Dynamic contrast-enhanced experiments using dynamic T1 maps. A: A scheme for dynamic T1 mapping. In each T1 measurement, 8 images are acquired after 2 inversions (red line); B: pixel-wise pharmacokinetic parameters of Ktrans and Ve for a hepatic tumor (T) mimicking pancreatic tumor metastatic to the liver. Hemorrhagic necrosis caused by vascular disruption was detected in hepatic tumor 10-h after CA4P treatment. CA4P: combretastatin A4 phosphate
Histomorphological evidence of mri-findings
Last but not least, all in vivo imaging findings should be properly backed up with gold-standard histopathology [Figure 10], as practiced in clinical routines for disease diagnosis. After the last MRI acquisition, animals were euthanatized for pancreas dissection. In our studies onpancreas-related topics, the exocrine system of rat pancreas was locally infused with Evans Blue dye for clear delineation of this organ, and consequently for hematoxylinandeosin stained microscopic histology analysis[4-7]. This requires not only basic anatomical knowledge but also meticulous skills for dissecting and sampling organs, tissues or pathologies as exactly displayed on corresponding images [Figure 10]. As an intermediate step, postmortem microangiography is often performed to gain more insight into tissue vascularity and to assess the therapeutic efficacy of a vascular disrupting agent [Figure 10A]. In this step, barium sulphate suspension was injected via abdominal aorta, with the specimen dissected for digital microangiography using a standard clinical mammographic unit[30]. Only imaging studies are conducted this way, can the accuracy and reliability of the conclusions be better ensured[31].
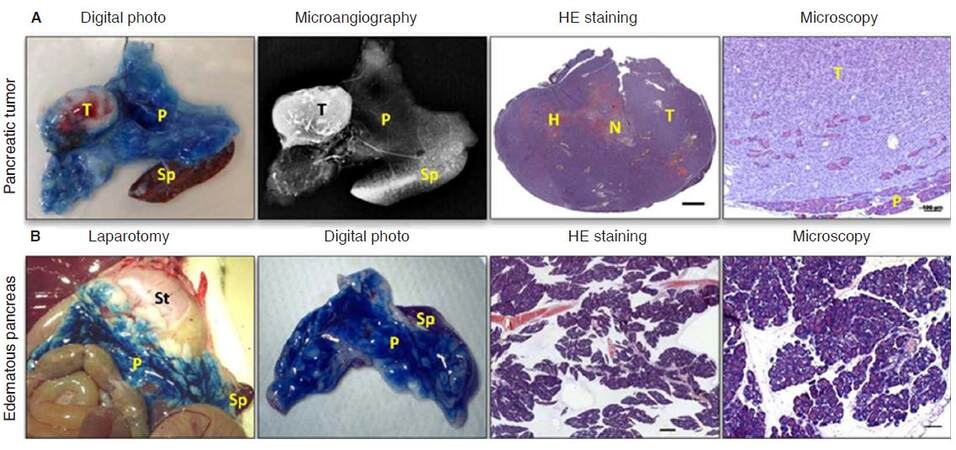
Figure 10. Ex-vivo evidence of MRI-findings. A: Pancreatic tumor was dissected after CA4P treatment, the tumor was located in Evans blue infused pancreas, as shown on digital photo. Corresponding microangiography indicated abundant vasculature in pancreatic tumor. HE staining of the entire pancreatic tumor indicates the presence of hemorrhagic necrosis after CA4P treatment (scale bar 1 mm). Tumor invasion into pancreatic tissue can be observed from microscopy assessment (scale bar 100 µm); B: in case of acute pancreatitis, laparotomy reveals edematous pancreas infused with Evans blue adjacent to stomach and spleen. Digital photo shows the dissected edematous pancreas in connection with spleen dissected from surrounding tissue under the guidance of Evans blue infusion. HE stained sections shows severe edema (scale bar 1 mm). More detailed microscopy demonstrates intracellular vacuolization and inflammatory cell infiltration (scale bar 100 µm). MRI: magnetic resonance imaging; CA4P: combretastatin A4 phosphate; HE: hematoxylin-eosin; C: colon; L: liver; H: hemorrhage; N: necrosis; P: pancreas; Si: small intestine; Sp: spleen; St: stomach; T: tumor; arrow head: duodenum
Summary
Due to the lack of pancreas-specific labeling and disruptive motion artifacts within the abdominal region, rodent pancreatic tissue itself is still very difficult to be distinguished from the surrounding structures, especially on 2D images. Hereby, we have described the application of modified MRI acquisition techniques for rat pancreatic imaging at clinical scanners with demonstrative examples. In vivo MRI parameters for rat pancreatic imaging at 3.0T Siemens scanners are summarized in Table 1. Except for 3D SPACE protocol, most 3D protocols can be finished around 5 min, while most 2D protocols are generally optimized to be accomplished within 2 min for a single measurement. In conclusion, state-of-the-art clinical MRI techniques could be translated into utilities in rat pancreatic imaging with high flexibility, which may provide an experimental platform for a wide range of preclinical research.
Declarations
Authors’ contributionsLiterature search, study design, imaging acquisition, data collection, figure generation, data analysis, result interpretation, writing the draft and proofreading: T. Yin, R. Peeters, J. Yu, Y. Ni
Financial support and sponsorshipNone.
Conflicts of interestThere are no conflicts of interest.
Patient consentNot applicable.
Ethics approvalNot applicable.
Copyright© The Author(s) 2017.
REFERENCES
1. Herrmann KH, Schmidt S, Kretz A, Haenold R, Krumbein I, Metzler M, Gaser C, Witte OW, Reichenbach JR. Possibilities and limitations for high resolution small animal MRI on a clinical whole-body 3T scanner. MAGMA 2012;25:233-44.
2. Krämer M, Herrmann KH, Biermann J, Freiburger S, Schwarzer M, Reichenbach JR. Self-gated cardiac Cine MRI of the rat on a clinical 3T MRI system. NMR Biomed 2015;28:162-7.
3. Grimm J, Potthast A, Wunder A, Moore A. Magnetic resonance imaging of the pancreas and pancreatic tumors in a mouse orthotopic model of human cancer. Int J Cancer 2003;106:806-11.
4. Yin T, Coudyzer W, Peeters R, Liu Y, Cona MM, Feng Y, Xia Q, Yu J, Jiang Y, Dymarkowski S, Huang G, Chen F, Oyen R, Ni Y. Three-dimensional contrasted visualization of pancreas in rats using clinical MRI and CT scanners. Contrast Media Mol Imaging 2015;10:379-87.
5. Yin T, Peeters R, Liu Y, Feng Y, Zhang X, Jiang Y, Yu J, Dymarkowski S, Himmelreich U, Oyen R, Ni Y. Visualization, quantification and characterization of caerulein-induced acute pancreatitis in rats by 3.0T clinical MRI, biochemistry and histomorphology. Theranostics 2017;7:285-294.
6. Yin T, Peeters R, Feng Y, Liu Y, Yu J, Dymarkowski S, Himmelreich U, Oyen R, Ni Y. Characterization of a rat orthotopic pancreatic head tumor model using three-dimensional and quantitative multi-parametric MRI. NMR Biomed 2017;30:3676.
7. Yin T, Liu YW, Peeters R, Feng YB, Ni YC. Pancreatic imaging: current status of clinical practices and small animal studies. World J Methodol 2017;7:101-7.
8. Braren R, Curcic J, Remmele S, Altomonte J, Ebert O, Rummeny EJ, Steingoetter A. Free-breathing quantitative dynamic contrast-enhanced magnetic resonance imaging in a rat liver tumor model using dynamic radial T(1) mapping. Invest Radiol 2011;46:624-31.
9. Bilgen M. Feasibility and merits of performing preclinical imaging on clinical radiology and nuclear medicine systems. Int J Mol Imaging 2013;2013:923823.
10. Pillai DR, Heidemann RM, Kumar P, Shanbhag N, Lanz T, Dittmar MS, Sandner B, Beier CP, Weidner N, Greenlee MW, Schuierer G, Bogdahn U, Schlachetzki F. Comprehensive small animal imaging strategies on a clinical 3 T dedicated head MR-scanner; adapted methods and sequence protocols in CNS pathologies. PLoS One 2011;6:e16091.
11. Graessner J. Bandwidth in MRI? Magnetom Flash 2013;2:3-8.
12. Sandrasegaran K, Lin C, Akisik FM, Tann M. State-of-the-art pancreatic MRI. AJR Am J Roentgenol 2010;195:42-53.
13. Emborg ME, Joers V, Fisher R, Brunner K, Carter V, Ross C, Raghavan R, Brady M, Raschke J, Kubota K, Alexander A. Intraoperative intracerebral MRI-guided navigation for accurate targeting in nonhuman primates. Cell Transplant 2010;19:1587-97.
14. Tabibian JH, Macura SI, O'Hara SP, Fidler JL, Glockner JF, Takahashi N, Lowe VJ, Kemp BJ, Mishra PK, Tietz PS, Splinter PL, Trussoni CE, LaRusso NF. Micro-computed tomography and nuclear magnetic resonance imaging for noninvasive, live-mouse cholangiography. Lab Invest 2013;93:733-43.
15. Finkenzeller T, Zorger N, Kühnel T, Paetzel C, Schuierer G, Stroszczynski C, Fellner C. Novel application of T1-weighted BLADE sequences with fat suppression compared to TSE in contrast-enhanced T1-weighted imaging of the neck: cutting-edge images? J Magn Reson Imaging 2013;37:660-8.
16. Weiskopf N, Suckling J, Williams G, Correia MM, Inkster B, Tait R, Ooi C, Bullmore ET, Lutti A. Quantitative multi-parameter mapping of R1, PD(*), MT, and R2(*) at 3T: a multi-center validation. Front Neurosci 2013;7:95.
17. Bojorquez JZ, Bricq S, Acquitter C, Brunotte F, Walker PM, Lalande A. What are normal relaxation times of tissues at 3 T? Magn Reson Imaging 2017;35:69-80.
18. Cheng HL, Stikov N, Ghugre NR, Wright GA. Practical medical applications of quantitative MR relaxometry. J Magn Reson Imaging 2012;36:805-24.
19. Thoeny HC, De Keyzer F, Chen F, Vandecaveye V, Verbeken EK, Ahmed B, Sun X, Ni Y, Bosmans H, Hermans R, van Oosterom A, Marchal G, Landuyt W. Diffusion-weighted magnetic resonance imaging allows noninvasive in vivo monitoring of the effects of combretastatin a-4 phosphate after repeated administration. Neoplasia 2005;7:779-87.
20. Rosenkrantz AB, Padhani AR, Chenevert TL, Koh DM, De Keyzer F, Taouli B, Le Bihan D. Body diffusion kurtosis imaging: Basic principles, applications, and considerations for clinical practice. J Magn Reson Imaging 2015;42:1190-202.
21. Jambor I, Merisaari H, Taimen P, Boström P, Minn H, Pesola M, Aronen HJ. Evaluation of different mathematical models for diffusion-weighted imaging of normal prostate and prostate cancer using high b-values: a repeatability study. Magn Reson Med 2015;73:1988-98.
22. Koh DM, Collins DJ, Orton MR. Intravoxel incoherent motion in body diffusion-weighted MRI: reality and challenges. AJR Am J Roentgenol 2011;196:1351-61.
23. Sánchez-González J. How to Identify and Avoid Artifacts on DWI. In: Diffusion MRI Outside the Brain. Berlin, Heidelberg: Springer; 2012. pp. 17-31.
24. Coenegrachts K, Van Steenbergen W, De Keyzer F, Vanbeckevoort D, Bielen D, Chen F, Dockx S, Maes F, Bosmans H. Dynamic contrast-enhanced MRI of the pancreas: initial results in healthy volunteers and patients with chronic pancreatitis. J Magn Reson Imaging 2004;20:990-7.
25. Kim JH, Lee JM, Park JH, Kim SC, Joo I, Han JK, Choi BI. Solid pancreatic lesions: characterization by using timing bolus dynamic contrast-enhanced MR imaging assessment--a preliminary study. Radiology 2013;266:185-96.
26. Tofts PS, Kermode AG. Measurement of the blood-brain barrier permeability and leakage space using dynamic MR imaging. 1. Fundamental concepts. Magn Reson Med 1991;17:357-67.
27. Tofts PS. T1-weighted DCE imaging concepts: modelling, acquisition and analysis. Magnetom Flash 2010;3:30-5.
28. Yankeelov TE, Luci JJ, Lepage M, Li R, Debusk L, Lin PC, Price RR, Gore JC. Quantitative pharmacokinetic analysis of DCE-MRI data without an arterial input function: a reference region model. Magn Reson Imaging 2005;23:519-29.
29. Ortuño JE, Ledesma-Carbayo MJ, Simões RV, Candiota AP, Arús C, Santos A. DCE@urLAB: a dynamic contrast-enhanced MRI pharmacokinetic analysis tool for preclinical data. BMC Bioinformatics 2013;14:316.
30. Yin T, Liu Y, Peeters R, Feng Y, Yu J, Himmelreich U, Oyen R, Ni Y. Vascular disrupting agent in pancreatic and hepatic tumor allografts: observations of locationdependent efficacy by MRI, microangiography and histomorphology. Br J Cancer 2017;117:1529-36.
Cite This Article
Export citation file: BibTeX | RIS
OAE Style
Yin T, Peeters R, Yu J, Ni Y. Development and applications of acquisition techniques for rat pancreatic imaging at clinical scanners. J Unexplored Med Data 2017;2:65-76. http://dx.doi.org/10.20517/2572-8180.2017.19
AMA Style
Yin T, Peeters R, Yu J, Ni Y. Development and applications of acquisition techniques for rat pancreatic imaging at clinical scanners. Journal of Unexplored Medical Data. 2017; 2: 65-76. http://dx.doi.org/10.20517/2572-8180.2017.19
Chicago/Turabian Style
Yin, Ting, Ronald Peeters, Jie Yu, Yicheng Ni. 2017. "Development and applications of acquisition techniques for rat pancreatic imaging at clinical scanners" Journal of Unexplored Medical Data. 2: 65-76. http://dx.doi.org/10.20517/2572-8180.2017.19
ACS Style
Yin, T.; Peeters R.; Yu J.; Ni Y. Development and applications of acquisition techniques for rat pancreatic imaging at clinical scanners. J. Unexplored. Med. Data. 2017, 2, 65-76. http://dx.doi.org/10.20517/2572-8180.2017.19
About This Article
Copyright

Data & Comments
Data


 Cite This Article 2 clicks

 Like This Article 21
likes
Like This Article 21
likes


Comments
Comments must be written in English. Spam, offensive content, impersonation, and private information will not be permitted. If any comment is reported and identified as inappropriate content by OAE staff, the comment will be removed without notice. If you have any queries or need any help, please contact us at support@oaepublish.com.